


First we need to understand why do we have to quantify Risk and how is related to Testing. Software Testing is carried out to reduce the risk at the Production and live environment. There could be a situation where we may not have enough time to conduct a full blown Testing. It becomes necessary to prioritize the Test cases because of the time limitations. Quantifying the risk helps to prioritize the Test Cases to be executed. Let us explain how?
In a nutshell – Risk is the product of damage and probability for damage to occur
Risk = Damage * Probability of Occurrence
We have evolved the Risk Based Testing based on the above mentioned definition of Risk. Though we always recommend for the complete (thorough) testing of application before it gets released to production, Risk based Testing methodology can only be used in a situation when time is a constraint for testing and the movement of release cannot be delayed to accommodate the complete testing effort. The test case execution has to be prioritized based on associated risk.
There are two major methods that will reduce the risk in the release with the minimal testing effort. They are
Test Automation is a proactive measure to be taken to reduce the test execution effort for future releases. The best way to shorten the Test execution cycle and still having the same confidence level on the software is to automate the available test suite for the functional testing. Experience has shown that more test cases can be run in relative less time, often within 30 to 35 % of time spent for manual testing.
However not all Testing effort can be automated. The entry criterion for Automation is that the application should be stable and at least one round of manual test execution should have been completed.
We recommend RAFT, Ready to use and Re-usable proven Test Automation Framework to expedite the Test Automation. Please reach out to for free demo on RAFT. We can also automate couple of your scenarious to demonstrate the features of RAFT
For new or existing project that does not having Test Automation suite, the alternative way to reduce the test execution effort is to prioritize the test execution based on the risk associated with the functionality.
The testing effort can be reduced by executing only the prioritized test cases. Prioritization has to be done based on risk. To prioritize test cases based on risk, the below bullet information is required and that are detailed in the subsequent section of this document.
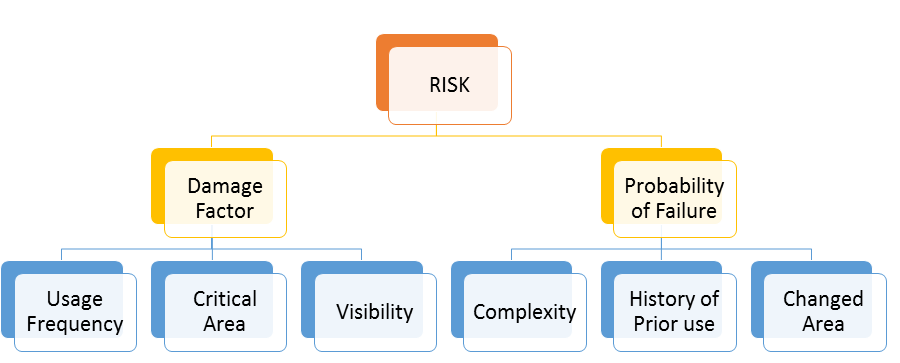
Risk is the product of damage and probability for damage to occur. Risk analysis assesses damage during use, usage frequency and determines probability of failure by looking at defect introduction.
Testing of most important and worst areas of the application has to be prioritized. Since the time allocated to testing is very less, it is not possible to test everything. Thus a decision has to be made based on
The goal is to find the worst defects first, the ones that need to be fixed before release and to find as many such defects possible.
The possible damage resulting from an area to be tested has to be determined. This means analyzing the most important areas of the application. The approach to classify the functions into more and less important areas is mentioned below. The factors to be considered for classifying the functions are detailed below.
The use of the software within its overall environment has to be analyzed. The ways the software may fail has to be analyzed. The possible consequences of such failure modes has to be found, or at least the worst ones. Software that is directly coupled to a process it controls is more critical than software whose output is manually reviewed before use. If software controls a process, this process itself should be analyzed. The inertia and stability of the process itself may make certain failures less interesting.
Output that is immediately needed during working hours is more critical than output that could be sent hours or days later. On the other hand, if large volumes of data to be sent by mail are wrong, just the cost of re-mailing may be horrible. The damage may be classified into the classes mentioned down below, or quantified into money value, whatever seems better. In systems with large variation of damage it is better to use damage as absolute money value, and not classify it into groups.
A possible hierarchy for grouping damage is the following. The importance is classified in the scale of 0 to 3. The failure with value 3 is the most important:
A failure would be catastrophic (3)
The problem would cause the computer to stop, maybe even lead to crashes in the environment (stop the whole country or business or product). Such failures may deal with large financial losses or even damage to human life. An example would be failures leading to loosing the license, i.e. authorities closing down the business, are part of this class. Serious legal consequences may also belong here. The last kind of catastrophic failures is endangering the life of people.
A failure would be damaging (2)
The program may not stop, but data may be lost or corrupted, or functionality may be lost until the program or computer is restarted. An example is equipment that will not work just around midnight on 31 December.
A failure would be hindering (1)
The user is forced to workarounds, to more difficult actions to reach the same results.
A failure would be annoying (0)
The problem does not affect functionality, but rather make the product less appealing to the user or customer. However, the customer can live with the problem.
The function has to be classified based on the visibility. If the function that is visible to more users is more important to the function that is visible to less number of users. This is because the loss incurred by the fail of function that is used by more users is more than the failure of functions that is being used by less number of users.
The Damage is dependent on how often a function or feature is used. Some functions may be used every day, other functions only a few times. Some functions may be used by many, some by few users. Give priority to the functions used often and heavily. The number of transactions per day may be an idea helping in finding priorities. A possibility to leave out some areas is to cut out functionality that is going to be used seldom, i.e. will only be used once per quarter, half-year or year. Such functionality may be tested after release, before its first use.
A possible hierarchy is outlined here (from (3)):
Most Frequent (3)
An area of the application that most users will come in contact with during an average usage session (e.g. startups, printing, saving).
Frequent (2)
An area of the application that most users will come in contact with eventually, but may be not during every usage session.
Occasional (1)
An area of the application that an average user may never visit, but that deals with functions a more serious or experienced user will need occasionally.
Rare (0)
An area of the application that most users never will visit, which is visited only if users do very uncommon steps of action. Critical failures, however, are still of interest.
Importance is classified by using a scale from 0 to 3. However, in some cases this does not sufficiently map the variation of the scale in reality. Then, it is better to use real values, like the cost of damage and the actual usage frequency.
The worst areas are the ones having most defects. The task is to predict where most defects are located. This is done by analyzing probable defect generators. In this section, some of the most important defect generators and symptoms for defect prone areas are presented. There exist many more, local factors have to be included in addition to the ones mentioned here.
Complexity may be the most important defect generator. Most complexity measures may indicate problematic areas. Examples include complex Business logic, a large data flow and even subjective complexity as understood by the designers. This means that we may have to do several complexity analyses, based on different aspects of complexity and find different areas of the product that might have problems.
The Change is an important defect generator. One reason is that changes are subjectively understood as easy, and thus not analyzed thoroughly for their impact. Another reason is that changes are done under time pressure and analysis is not completely done. The result is side-effects. We may have to sort the changes by functional area or otherwise and find the areas which have had exceptionally many changes. Many changes are also a symptom of badly done analysis. Thus, heavily changed areas may not correspond to user expectations.
Components developed using new technology has to be considered as the defect generator. The methods or models or architecture of a new and unproven kind are used then the software may be more unreliable.
Time pressure leads to people making short-cuts. People concentrate on getting the job done, and they often try to skip quality control activities, thinking optimistically that everything will go fine.
Time pressure may also lead to overtime work. It is well known, however, that people loose concentration after prolonged periods of work. This may lead to more defects. Together with short-cuts in applying reviews and inspections may lead to extreme levels of defects density.
Data about time pressure during development can best be found by studying time lists, project meeting minutes, or by contacting the project managers or programmers.
The Defect repair leads to changes which lead to new defects, and defect prone areas tend to persist. Experience exists that defect prone areas in a delivered system can be traced back to defect prone areas in reviews and unit and subsystem testing. Evidence in studies shows those modules that had faults in the past are likely to have faults in the future. If defect statistics from design and code reviews, and unit and subsystem testing exist, then priorities can be chosen for later test phases.
If many users have used software before, an active user group can be helpful in understanding the error prone areas and determining the risk involved with them. Beta testing may be possible. For a completely new system, a user group may need to be defined, and prototyping may be applied. Typically, completely new functional areas are most defect-prone because of the reason that there is a greater possibility of having ambiguous requirements or requirements not clearly defined.
It is reasonable to have a look at how developers have tested the software before, and what kind of problems they typically overlook. Analyze the unit test quality. This may lead to a further tailoring of the test case selection methods.
Looking at these factors will determine the fault density of the areas to be tested. However, using only this will normally over-value some areas. Typically, larger components will be tested too much. Thus, a correction factor should be applied: Functional size of the area to be tested. I.e. the total weight of this area will be “fault proneness / functional volume”. This factor can be found from function point analysis or from counting number of line of code if that is available.
The test areas for testing have to be prioritized based on risk values. Risk is the product of damage and probability of failure
Risk = Damage * Probability of failure
Risk value can be calculated by assigning weight to factors of damage and probability explained in the previous sections
The Risk calculation can be done in three steps as mentioned below:
Step 1: Assign weight to the chosen parameters of damage. For e.g., (2-4-8)
Step 2: Assign weight to the chosen parameters of probability. For e.g., (2-4-8)
Step 3: Calculate the weighted sum (Damage* Probability)
The Example is shown in the table below:
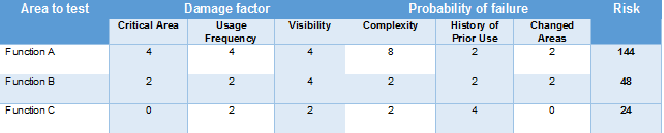
Risk Formula
Damage = (Weight for damage factor 1 + Weight for damage factor 2 + Weight for damage factor n)
Probability = (Weight for probability factor 1 + Weight for probability factor 2 + Weight for probability factor n)
Risk Value for Function A = (4+4+4) * (8+2+2)
= 12 * 12
= 144
The test areas have to be prioritized based on the risk values. In this case the Function A has the highest priority for testing.
Author: Jaleel Mohammed | Posted On: 8th December 2017 | Category: Article
© 2024 Novature Tech Pvt Ltd. All Rights Reserved.